|
Asking the question of how fast the global economy is sinking implies the following subsequent question: how fast will it recover? But one question at a time. Early data that will measure the unfolding economic impact of the coronavirus shutdown will be the German unemployment rate for March, which is coming up on March 31, followed by US payrolls on April 3 which will also track March. In the meantime, the US will post two weekly jobless claims reports which look certain to swell – perhaps beyond recognition.
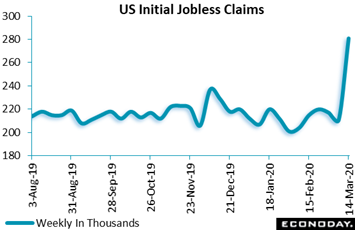 Early estimates for the next batch of initial US jobless claims are unsettling, some calling for as many as 1 or 2 or more million claimants in the March 21 week. This would put into question the ability of state offices to actually keep track of such a staggering total. In the recession years of 2008 and 2009, initial claims climbed in comparatively orderly steps from the 300,000 to 600,000 levels. In the latest data which were for the March 14 week, the number of first-time US jobless claimants rose by a very steep 70,000 to 281,000 and a 2-1/2 year high. This was the first signal of major dislocations for the March employment report that will be posted April 3, a report that importantly was sampled in the March 14 week and will not capture layoffs in the second half of the month. Those states hit hard by the coronavirus reported substantial increases in the March 14 week: up nearly 15,000 in California with Washington up 8,200, and Massachusetts up nearly 2,700. Accommodation and food services took the heaviest hits. Early estimates for the next batch of initial US jobless claims are unsettling, some calling for as many as 1 or 2 or more million claimants in the March 21 week. This would put into question the ability of state offices to actually keep track of such a staggering total. In the recession years of 2008 and 2009, initial claims climbed in comparatively orderly steps from the 300,000 to 600,000 levels. In the latest data which were for the March 14 week, the number of first-time US jobless claimants rose by a very steep 70,000 to 281,000 and a 2-1/2 year high. This was the first signal of major dislocations for the March employment report that will be posted April 3, a report that importantly was sampled in the March 14 week and will not capture layoffs in the second half of the month. Those states hit hard by the coronavirus reported substantial increases in the March 14 week: up nearly 15,000 in California with Washington up 8,200, and Massachusetts up nearly 2,700. Accommodation and food services took the heaviest hits.
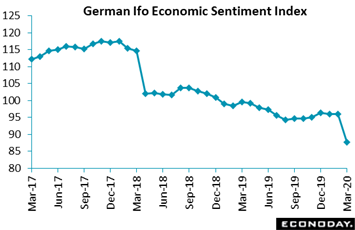 Outside of weekly jobless claims, comprehensive data are going to be scarce the next couple of weeks. This puts the focus on anecdotal data including the flash PMIs for March that will unroll across the globe on Tuesday and which may or may not pick up the sudden shutdowns in the auto and aerospace sectors. Two anecdotal reports for March that have already been released are Germany's Ifo, which samples businesses, and the ZEW survey which samples analysts. Ifo's business climate index fell very deeply to a provisional 87.7, down from 96.0 in February for the sharpest drop since 1991. The index is now at its weakest level since August 2009. March declines were concentrated in expectations and point to a significant hit to German businesses and raise the likelihood of recession. This report, from Munich's Information and Forschung, was released early because of the crisis with the month's final data to be posted on the originally scheduled March 25 date. Outside of weekly jobless claims, comprehensive data are going to be scarce the next couple of weeks. This puts the focus on anecdotal data including the flash PMIs for March that will unroll across the globe on Tuesday and which may or may not pick up the sudden shutdowns in the auto and aerospace sectors. Two anecdotal reports for March that have already been released are Germany's Ifo, which samples businesses, and the ZEW survey which samples analysts. Ifo's business climate index fell very deeply to a provisional 87.7, down from 96.0 in February for the sharpest drop since 1991. The index is now at its weakest level since August 2009. March declines were concentrated in expectations and point to a significant hit to German businesses and raise the likelihood of recession. This report, from Munich's Information and Forschung, was released early because of the crisis with the month's final data to be posted on the originally scheduled March 25 date.
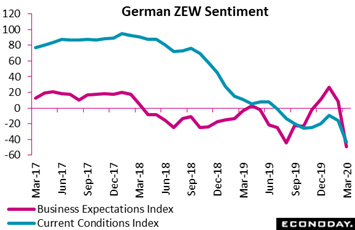 ZEW's survey for March, released as planned on March 17 by Mannheim's Centre for European Economic Research, came in well short of the market consensus; analysts sharply marked down their assessments of current conditions and especially, like the Ifo, their expectations for future activity. The current conditions measure fell a very steep 27.4 points to minus 43.1, a level not seen since March 2010. Expectations were cut even more dramatically, from plus 8.7 to minus 49.5, their lowest score since December 2011 and the steepest monthly deterioration on record. Both the Ifo and ZEW point to recession, and their abrupt movement from February to March is evidence that the sudden ferocity of the coronavirus has caught businesses and analysts completely off guard (along with just about everyone else). ZEW's survey for March, released as planned on March 17 by Mannheim's Centre for European Economic Research, came in well short of the market consensus; analysts sharply marked down their assessments of current conditions and especially, like the Ifo, their expectations for future activity. The current conditions measure fell a very steep 27.4 points to minus 43.1, a level not seen since March 2010. Expectations were cut even more dramatically, from plus 8.7 to minus 49.5, their lowest score since December 2011 and the steepest monthly deterioration on record. Both the Ifo and ZEW point to recession, and their abrupt movement from February to March is evidence that the sudden ferocity of the coronavirus has caught businesses and analysts completely off guard (along with just about everyone else).
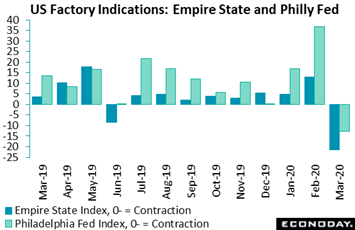 In less drastic news, early March assessments from two US manufacturing surveys could have been a lot worse. But again, that's early March and not the still unfolding second half of the month. Empire State's manufacturing index dropped much more than expected to minus 21.5 yet this index was nearly as low, at minus 16.9, as recently as the oil-price collapse four years ago. And details in the report did point to a well functioning manufacturing sector that, at mid-month anyway, was only slowing and not seizing up. Contraction in new orders was less severe than the headline decline while unfilled orders continued to climb. And the sample was still hiring, at least at mid-month which was before the US auto sector shutdown. The Philadelphia Fed index, like Empire State, was also thrown back by the virus, to minus 12.7 for a collapse of nearly 50 points. In fact it was February's 3-year high of 36.7, which at the time was oddly positive, that underscores just how much the virus has taken people by surprise. At the current pace of events, timely reports like the Empire State and Philadelphia Fed are already out of date. In less drastic news, early March assessments from two US manufacturing surveys could have been a lot worse. But again, that's early March and not the still unfolding second half of the month. Empire State's manufacturing index dropped much more than expected to minus 21.5 yet this index was nearly as low, at minus 16.9, as recently as the oil-price collapse four years ago. And details in the report did point to a well functioning manufacturing sector that, at mid-month anyway, was only slowing and not seizing up. Contraction in new orders was less severe than the headline decline while unfilled orders continued to climb. And the sample was still hiring, at least at mid-month which was before the US auto sector shutdown. The Philadelphia Fed index, like Empire State, was also thrown back by the virus, to minus 12.7 for a collapse of nearly 50 points. In fact it was February's 3-year high of 36.7, which at the time was oddly positive, that underscores just how much the virus has taken people by surprise. At the current pace of events, timely reports like the Empire State and Philadelphia Fed are already out of date.
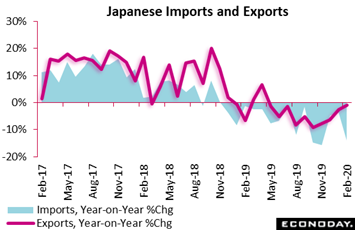 Turning to Asia, trade data for March, set for release on April 20, will be some of the first major data to reflect the continuing impact of the coronavirus on Japan. As of February, Japanese trade was improving but still in contraction, at a year-on-year 1.0 percent for exports and 14.0 percent for imports. These data are volatile from report to report but the trends, as seen in the graph, are clear: contracting rates since early last year that are repeated again and again in trade data across the globe. Exports fell 1.0 percent on the year in February after dropping 2.6 percent in January with demand once again weak across the board with exports to China, the U.S. and the European Union all falling on the year. How immediately Japanese exports have been affected by the coronavirus shutdown in Europe and the U.S. will be apparent in the April 20 update. Looking back at February, imports were pulled lower by petroleum which fell 14.0 percent on the year and looks to move even lower given the price collapse underway in oil. Despite export weakness, February was a good month for GDP in Japan, seeing its trade balance swing into a ¥1,110 billion surplus from a deficit of ¥1,313 billion in January. Turning to Asia, trade data for March, set for release on April 20, will be some of the first major data to reflect the continuing impact of the coronavirus on Japan. As of February, Japanese trade was improving but still in contraction, at a year-on-year 1.0 percent for exports and 14.0 percent for imports. These data are volatile from report to report but the trends, as seen in the graph, are clear: contracting rates since early last year that are repeated again and again in trade data across the globe. Exports fell 1.0 percent on the year in February after dropping 2.6 percent in January with demand once again weak across the board with exports to China, the U.S. and the European Union all falling on the year. How immediately Japanese exports have been affected by the coronavirus shutdown in Europe and the U.S. will be apparent in the April 20 update. Looking back at February, imports were pulled lower by petroleum which fell 14.0 percent on the year and looks to move even lower given the price collapse underway in oil. Despite export weakness, February was a good month for GDP in Japan, seeing its trade balance swing into a ¥1,110 billion surplus from a deficit of ¥1,313 billion in January.
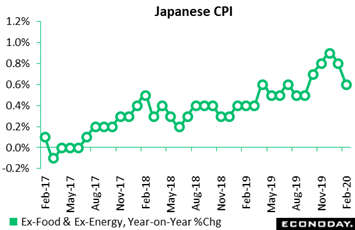 Preliminary inflation data from Germany for the month of March will open the March 30 week, followed on Tuesday by European inflation data. Consumer and producer prices out of China for March will follow at mid-month, all offering key updates to the price effects of the virus. Going into the effects, pressures were low including in Japan where consumer price data eased further. Headline consumer prices were up only 0.4 percent on the year in February, down from 0.7 percent in January. Food and housing prices were flat on the month with energy already weak. When excluding food and energy (as tracked in graph) yearly price growth slowed to 0.6 percent from 0.8 percent, certainly not good news for the Bank of Japan and its painful-to-watch and deepening struggle to lift inflation. Preliminary inflation data from Germany for the month of March will open the March 30 week, followed on Tuesday by European inflation data. Consumer and producer prices out of China for March will follow at mid-month, all offering key updates to the price effects of the virus. Going into the effects, pressures were low including in Japan where consumer price data eased further. Headline consumer prices were up only 0.4 percent on the year in February, down from 0.7 percent in January. Food and housing prices were flat on the month with energy already weak. When excluding food and energy (as tracked in graph) yearly price growth slowed to 0.6 percent from 0.8 percent, certainly not good news for the Bank of Japan and its painful-to-watch and deepening struggle to lift inflation.
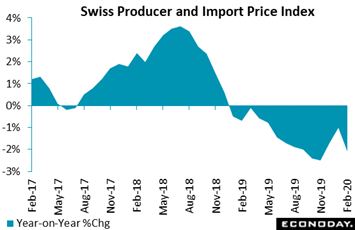 Price pressures at the producer level and also prices for imports have been even softer than consumer prices. Annual inflation for the combined producer and import price index for Switzerland fell to minus 2.1 percent in February from January's minus 1.0 percent, the most negative outturn since the rate first slipped below zero in January 2019. The PPI was down 0.6 percent on the year with imports at minus 3.9 percent, both reflecting what was then a modest retreat in oil prices: from $55 for Brent in early February to $50 in late February (and to under $30 so far in March). Germany also posted its producer price report for February, similarly showing weakness with this year-on-year headline at minus 0.1 percent. With oil combining with virus effects, deflation in the production and goods sectors may well become an unwanted negative in all the trouble. Price pressures at the producer level and also prices for imports have been even softer than consumer prices. Annual inflation for the combined producer and import price index for Switzerland fell to minus 2.1 percent in February from January's minus 1.0 percent, the most negative outturn since the rate first slipped below zero in January 2019. The PPI was down 0.6 percent on the year with imports at minus 3.9 percent, both reflecting what was then a modest retreat in oil prices: from $55 for Brent in early February to $50 in late February (and to under $30 so far in March). Germany also posted its producer price report for February, similarly showing weakness with this year-on-year headline at minus 0.1 percent. With oil combining with virus effects, deflation in the production and goods sectors may well become an unwanted negative in all the trouble.
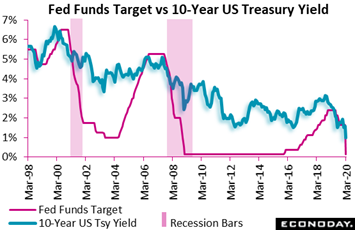 Three gutter balls in a row should be enough for anyone. The last three times the Federal Reserve raised rates, big trouble followed each time. This is not what the makers of monetary policy would have been predicting for their efforts 20 years ago. The graph tracks the Fed's policy rate against the US 10-year Treasury yield: Note the recession bars in red! Twenty years ago the Fed began to lift its policy rate to a peak of 6-1/2 percent where it held for the last half of 2000. Three months later, by March 2001, the economy was in recession. Coincidence you say? In 2006 the Fed lifted the funds rate to that cycle's peak of 5-1/4 percent where it held until August 2007. By December 2007, just four months later, the economy was in recession. And during this economic cycle, the Fed lifted the rate to a puny little peek, but still a peek, of 2-3/8 percent where it held from January last year until July last year. Based on this comparison a recession definitely appears to be overdo. In any case, the meaning of "counter cyclical" monetary policy as practiced takes on new clarity: pulling the economy from growth into contraction. Taking a look at the 10-year Treasury yield shows that Fed policy, which targets changes only in short-term rates, does in fact determine the course of long rates whether the Fed concedes it or not. Like other financial instruments, the 10-year note has swung wildly over the last month, from a 1-1/2 percent yield to a mid-month low at 1/2 percent to end the week just under 1 percent. Three gutter balls in a row should be enough for anyone. The last three times the Federal Reserve raised rates, big trouble followed each time. This is not what the makers of monetary policy would have been predicting for their efforts 20 years ago. The graph tracks the Fed's policy rate against the US 10-year Treasury yield: Note the recession bars in red! Twenty years ago the Fed began to lift its policy rate to a peak of 6-1/2 percent where it held for the last half of 2000. Three months later, by March 2001, the economy was in recession. Coincidence you say? In 2006 the Fed lifted the funds rate to that cycle's peak of 5-1/4 percent where it held until August 2007. By December 2007, just four months later, the economy was in recession. And during this economic cycle, the Fed lifted the rate to a puny little peek, but still a peek, of 2-3/8 percent where it held from January last year until July last year. Based on this comparison a recession definitely appears to be overdo. In any case, the meaning of "counter cyclical" monetary policy as practiced takes on new clarity: pulling the economy from growth into contraction. Taking a look at the 10-year Treasury yield shows that Fed policy, which targets changes only in short-term rates, does in fact determine the course of long rates whether the Fed concedes it or not. Like other financial instruments, the 10-year note has swung wildly over the last month, from a 1-1/2 percent yield to a mid-month low at 1/2 percent to end the week just under 1 percent.
Market safety nets are fully deployed with global central banks busy cutting rates as well as adding liquidity to the markets and buying government bonds and other long-term instruments as well. And major fiscal moves across the globe are being put in place, or about to be put in place, to further cushion the unfolding economic shock. Hopefully hints of recovery in China, where rates of infection are reportedly easing, point to a timely resumption for economic activity everywhere.
**Jeremy Hawkins, Brian Jackson and Mace News contributed to this article
The PMIs for March, and early indications on the depth of the month's virus slowdown, will be hitting the market all on Tuesday in this order: Japan, France, Germany, Eurozone, US. Very substantial declines are expected, with readings generally expected to drop about 10 points from the 50 breakeven line to the mid-to-low 40s or high 30s. Confidence data, which like the PMIs are very timely, will also dominate the week and all are expected to show sharp declines: EC consumer confidence flash from the Eurozone on Monday with Germany's Gfk consumer climate index on Thursday; French and Italian sentiment data will be posted on Thursday and Friday. Thrown into the week's mix will be February data on US durable goods on Wednesday, which had already been struggling before the virus, and new home sales on Tuesday which had been booming.
Eurozone: EC Consumer Confidence Flash for March (Mon 15:00 GMT; Mon 16:00 CET; Mon 11:00 EDT)
Consensus Forecast: -10.0
Forecasters see March's consumer confidence flash for the Eurozone falling but not severely, down 3.4 points to minus 10.0.
Japanese Composite PMI Flash for February (Tue 00:30 GMT; Tue 09:30 JST; Mon 20:30 EDT)
Consensus Forecast, Manufacturing: 45.0
Consensus Forecast, Services: 44.0
Consensus Forecast, Composite: 44.2
Forecasters see Japan's PMIs extending February's declines in March: manufacturing consensus 45.0 versus 47.6 in February, services 44.0 versus 46.7, and the composite 44.2 versus 47.0.
French PMI Flash for March (Tue 08:15 GMT; Tue 09:15 CET; Tue 04:15 EDT)
Consensus Forecast, Manufacturing: 40.5
Consensus Forecast, Services: 37.1
Consensus Forecast, Composite: 38.0
At a consensus 40.5, France's PMI manufacturing flash for March is expected to show significant effects from the coronavirus versus February's 49.8 (revised from a 49.7 flash). The services flash in March is seen falling very steeply to 37.1 with the composite at 38.0; both of these readings were over 50 in February.
German PMI Composite Flash for March (Tue 08:30 GMT; Tue 09:30 CET; Tue 04:30 EDT)
Consensus Forecast, Manufacturing: 38.7
Consensus Forecast, Services: 38.5
Consensus Forecast, Composite: 38.5
A breakdown below 40 is the call for March's flash German PMI: at 38.7 for manufacturing versus 48.0 in February (revised from an initial 47.8). March's consensus for German services is 38.5 with the composite consensus also at 38.5; both of these readings were over 50 in February.
Eurozone PMI Flash for March (Tue 09:00 GMT; Tue 10:00 CET; Tue 05:00 EDT)
Consensus Forecast, Manufacturing: 40.0
Consensus Forecast, Services: 38.0
Consensus Forecast, Composite: 39.0
The Eurozone's PMIs showed no immediate effects from the coronavirus in February but very substantial effects, roughly 10 point declines, are expected for March. The consensus for manufacturing is 40.0 versus February's 49.2 (revised from an initial 49.1) with the consensus for March services at 38.0 and the composite at 39.0.
UK: CIPS/PMI Composite Flash for March (Tue 09:30 GMT; Tue 05:30 EDT)
Consensus Forecast, Manufacturing: 45.0
Consensus Forecast, Services: 44.0
Consensus Forecast, Composite: 44.2
CIPS/PMI data were on the rise and showing no coronavirus effects at all, but that was February. For March, the manufacturing PMI is seen at 45.0 versus February's 51.7 (revised from 51.9) with services seen at 44.0 and the composite at 44.2.
US PMI Composite Flash for March (Tue 13:45 GMT; Tue 9:45 EDT)
Consensus Forecast, Manufacturing: 43.0
Consensus Forecast, Services: 43.9
Consensus Forecast, Composite: 44.2
Growth in the manufacturing PMI slowed by a point in February in limited initial reaction from the US samples to the coronavirus. For preliminary March the consensus is for a substantial manufacturing slowdown, to 43.0 versus a final 50.7 in February (revised from an initial 50.8). In contrast to manufacturing, the services PMI showed a much sharper reaction in February, down nearly 4 points to 49.4 with March seen at 43.9 for a consensus composite score of 44.2.
US New Home Sales for February (Tue 14:00 GMT; Tue 10:00 EDT)
Consensus Forecast, Annualized Rate: 743,000
At an annual rate of 764,000 and a 13-year high, new home sales in the US far exceeded expectations in a January report that included a sharp jump in prices. For February, Econoday's consensus is give back but only some, to a 743,000 rate.
US Durable Goods Orders for February (Fri 12:30 GMT; Fri 08:30 EDT)
Consensus Forecast, Month-to-Month Change: -0.6%
Consensus Forecast: Ex-Transportation: -0.3%
Effects from the coronavirus are expected to be limited for February durable goods orders. Forecasters see a 0.6 percent decrease at the headline level with ex-transportation orders down 0.3 percent.
Germany: GfK Consumer Climate for April (Thu 07:00 GMT; Thu 08:00 CET; Thu 03:00 EST)
Consensus Forecast: 9.4
A modest dip to 9.4 is the call for April's Gfk survey which in March edged over expectations at 9.8.
French Business Climate Indicator for March (Thu 07:45 GMT; Thu 08:45 CET; Thu 03:45 EDT)
Consensus Forecast, Manufacturing: 94
On INSEE's measure, sentiment in manufacturing in March is seen at 94 which would compare with 102 in February and a long run average of 100.
Italian Business and Consumer Confidence for March (Fri 09:00 GMT; Fri 10:00 CET; Fri 05:00 EDT)
Consensus Forecast, Consumer Confidence: 91.0
Consensus Forecast, Manufacturing Confidence: 92.5
Going into the coronavirus outbreak in Italy, consumer confidence held steady in February at 111.4 though expectations for March are at 91.0. Manufacturing confidence improved in the February report to 100.6 with, however, 92.5 the expectation for March.
|

![[Apple App Store]](/images/AppleAppStore.png)
![[Econoday on Kindle]](/images/kindle.jpg)