|
Central banks are keeping busy adding stimulus at the same time that dramatically weak economic data are coming out. But markets aren't responding to these factors, neither of which are a surprise. It's infection rates only that matter for both the markets and the economic outlook. The length of the downturn is unknown, but we can at least try to assess its current depth.
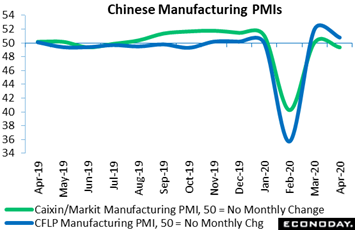 Though Chinese PMIs for April are not pointing to recovery, they do provide a note of hope, holding roughly at levels in March that marked stabilization from the virus collapse in January and February. The official PMI, posted by the China Federation of Logistics and Purchasing (CFLP), came in just above breakeven 50, at 50.8 in April to indicate little change in composite activity relative to March which itself, at 52.0, indicated slight growth (only 2 points above 50) compared to February's deep contraction of 35.7. This pattern is confirmed by a 50.1 score in a separate survey complied by Caixin, a Chinese financial media group whose report is published by Markit Economics of the UK. Diffusion readings can be deceptive, in this case pointing seemingly to the hoped for V-recovery when in fact pointing only to stability at February's lowered base. The accompanying graph is in fact illusory: There is yet to be any indication of significant post-virus acceleration in China. Yet stability is much better than deepening collapse, though virus effects on China's customers may well result in a second leg down for the next set of PMIs in May. Though Chinese PMIs for April are not pointing to recovery, they do provide a note of hope, holding roughly at levels in March that marked stabilization from the virus collapse in January and February. The official PMI, posted by the China Federation of Logistics and Purchasing (CFLP), came in just above breakeven 50, at 50.8 in April to indicate little change in composite activity relative to March which itself, at 52.0, indicated slight growth (only 2 points above 50) compared to February's deep contraction of 35.7. This pattern is confirmed by a 50.1 score in a separate survey complied by Caixin, a Chinese financial media group whose report is published by Markit Economics of the UK. Diffusion readings can be deceptive, in this case pointing seemingly to the hoped for V-recovery when in fact pointing only to stability at February's lowered base. The accompanying graph is in fact illusory: There is yet to be any indication of significant post-virus acceleration in China. Yet stability is much better than deepening collapse, though virus effects on China's customers may well result in a second leg down for the next set of PMIs in May.
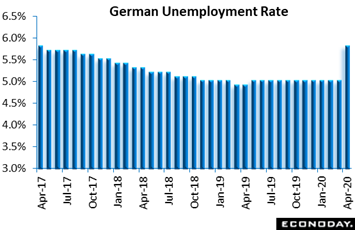 Another feature of global economic reports is the striking collapse in North American employment compared to the comparatively limited losses in Asia and Europe, at least so far. Still, Germany's unemployment rate did rise more than expected in April, up 6 tenths to 5.8 percent. This is the biggest monthly jump in more than 50 years of available data and already eclipses the 7 tenths rise during the whole of the financial crisis 12 years ago. The number of Germans out of work in April rose by a record 373,000 to 2.639 million, with prospects likewise deteriorating as vacancies fell 66,000 after falling 10,000 in the early virus effects of March. April jobs data will be posted in the coming week by both the US and Canada where far greater contraction is the call. Another feature of global economic reports is the striking collapse in North American employment compared to the comparatively limited losses in Asia and Europe, at least so far. Still, Germany's unemployment rate did rise more than expected in April, up 6 tenths to 5.8 percent. This is the biggest monthly jump in more than 50 years of available data and already eclipses the 7 tenths rise during the whole of the financial crisis 12 years ago. The number of Germans out of work in April rose by a record 373,000 to 2.639 million, with prospects likewise deteriorating as vacancies fell 66,000 after falling 10,000 in the early virus effects of March. April jobs data will be posted in the coming week by both the US and Canada where far greater contraction is the call.
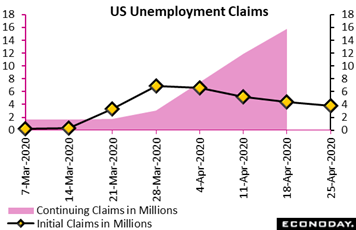 The first data to signal the extent of the virus impact were US jobless claims which began their ascent in mid-March. This weekly series has made for grim and painful reading but slow improvement, that is declines that are less severe, is underway. Initial claims rose 3.839 million in the April 25 week, and though this was moderately above Econoday's consensus for 3.5 million it marked the fourth straight decline from a late March peak of 6.867 million. From the beginning of the crisis in the March 14 week, initial claims in the US have totaled 30.3 million. This carnage, equal to claims totals over the past 2-1/2 years, has been compressed into seven weeks -- and with millions more no doubt still filing or soon to file. The first data to signal the extent of the virus impact were US jobless claims which began their ascent in mid-March. This weekly series has made for grim and painful reading but slow improvement, that is declines that are less severe, is underway. Initial claims rose 3.839 million in the April 25 week, and though this was moderately above Econoday's consensus for 3.5 million it marked the fourth straight decline from a late March peak of 6.867 million. From the beginning of the crisis in the March 14 week, initial claims in the US have totaled 30.3 million. This carnage, equal to claims totals over the past 2-1/2 years, has been compressed into seven weeks -- and with millions more no doubt still filing or soon to file.
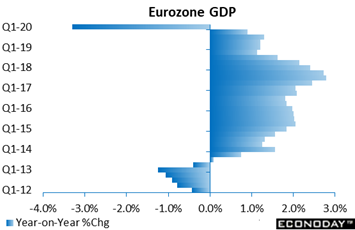 Early estimates for GDP are offering their measurements of the destruction. The first estimate for first-quarter Eurozone GDP contracted at a record 3.8 percent compared to the fourth-quarter. And this reflects only one single month of virus impact, that in March. The decline reduced year-on-year growth by more than 4 percentage points to minus 3.3 percent, the most negative result since the third quarter of 2009. For comparison and an unwelcome hint of what to expect in the second quarter, Chinese GDP released in the prior week, which reflected a full three months of virus effects, contracted 9.8 percent quarter-to-quarter and 6.8 percent annually. Early estimates for GDP are offering their measurements of the destruction. The first estimate for first-quarter Eurozone GDP contracted at a record 3.8 percent compared to the fourth-quarter. And this reflects only one single month of virus impact, that in March. The decline reduced year-on-year growth by more than 4 percentage points to minus 3.3 percent, the most negative result since the third quarter of 2009. For comparison and an unwelcome hint of what to expect in the second quarter, Chinese GDP released in the prior week, which reflected a full three months of virus effects, contracted 9.8 percent quarter-to-quarter and 6.8 percent annually.
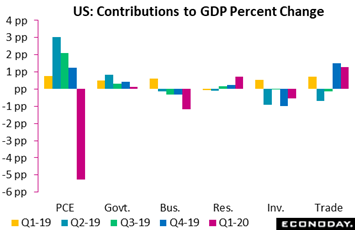 At annual contraction of 4.8 percent, US GDP fell more sharply than expected in the first quarter, especially personal consumption expenditures (real consumer spending) which fell at a 7.6 percent pace with weakness centered in vehicles, accommodation, recreation, and also health care. The graph tracks the percentage point contribution of components to the minus 4.8 percent result: at minus 5.26 points for PCE, for example. In contrast to PCE, government consumption was a positive, rising at an annual 0.7 percent pace and, led by non-defense spending at the Federal level, contributing 0.13 percentage points. Non-residential investment (business investment) fell at an 8.6 percent pace, pulling GDP down by 1.17 points with contraction for structures and especially equipment severe. Residential investment was a strong positive in the quarter, contributing 0.74 points in a reminder of how strong new home sales once were. Businesses were working down their inventories going into the virus which pulled GDP down by 0.53 points while trade, in a quirk on how GDP is calculated, actually contributed 1.30 points despite annual contraction in exports of 8.7 percent! The quirk is that contraction in US imports (bad news here for China) fell at a much greater pace of 15.3 percent. At annual contraction of 4.8 percent, US GDP fell more sharply than expected in the first quarter, especially personal consumption expenditures (real consumer spending) which fell at a 7.6 percent pace with weakness centered in vehicles, accommodation, recreation, and also health care. The graph tracks the percentage point contribution of components to the minus 4.8 percent result: at minus 5.26 points for PCE, for example. In contrast to PCE, government consumption was a positive, rising at an annual 0.7 percent pace and, led by non-defense spending at the Federal level, contributing 0.13 percentage points. Non-residential investment (business investment) fell at an 8.6 percent pace, pulling GDP down by 1.17 points with contraction for structures and especially equipment severe. Residential investment was a strong positive in the quarter, contributing 0.74 points in a reminder of how strong new home sales once were. Businesses were working down their inventories going into the virus which pulled GDP down by 0.53 points while trade, in a quirk on how GDP is calculated, actually contributed 1.30 points despite annual contraction in exports of 8.7 percent! The quirk is that contraction in US imports (bad news here for China) fell at a much greater pace of 15.3 percent.
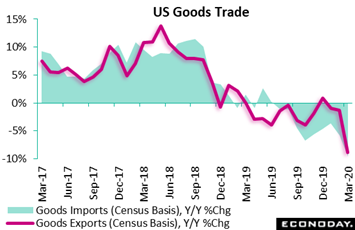 Contraction in trade was already a substantial trend for the whole global economy going into the virus. In initial virus effects for the month of March, US imports of goods (excluding services) were down 9.6 percent from a year ago with exports of goods down 8.9 percent. Exports of vehicles, reflecting factory shutdowns in the US, plunged 18.8 percent on the year with exports of consumer goods down 15.4 percent and capital goods down 9.8 percent. These are staggering rates of contraction that illustrate how deep this virus has hit. And the import side shows just how much US demand has dropped: consumer goods down 14.9 percent, vehicles down 12.8 percent, and capital goods down 7.4 percent. Country breakdowns are not released for the initial goods portion of US trade data and will be updated in the coming week with the international trade report for both goods and services. Note that the Census Bureau did not detail effects from the virus in the trade data, but did say, as it has in other reports, that many businesses are operating on a limited basis or have shuttered their operations completely. Still the bureau said response rates and data quality are hanging in there. Contraction in trade was already a substantial trend for the whole global economy going into the virus. In initial virus effects for the month of March, US imports of goods (excluding services) were down 9.6 percent from a year ago with exports of goods down 8.9 percent. Exports of vehicles, reflecting factory shutdowns in the US, plunged 18.8 percent on the year with exports of consumer goods down 15.4 percent and capital goods down 9.8 percent. These are staggering rates of contraction that illustrate how deep this virus has hit. And the import side shows just how much US demand has dropped: consumer goods down 14.9 percent, vehicles down 12.8 percent, and capital goods down 7.4 percent. Country breakdowns are not released for the initial goods portion of US trade data and will be updated in the coming week with the international trade report for both goods and services. Note that the Census Bureau did not detail effects from the virus in the trade data, but did say, as it has in other reports, that many businesses are operating on a limited basis or have shuttered their operations completely. Still the bureau said response rates and data quality are hanging in there.
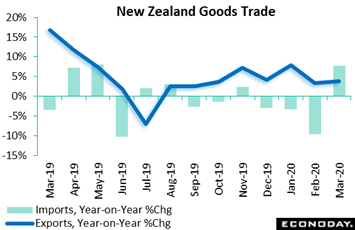 One country that has not only faired better than others on trade but has declared itself virus free, is lucky New Zealand. New Zealand's merchandise trade surplus widened from NZ$531 million in February to NZ$672 million in March. Growth in both exports and imports has improved as the country's trade flows have shifted from China and Australia to other markets, including the US and Japan. Exports of goods rose a year-on-year 3.8 percent in March, picking up from an increase of 3.4 percent in February. Food exports were particularly strong, boosted by a record harvest of kiwifruit and strong prices for meat and dairy products, partly offset by weaker demand for forestry products. Exports to the US, Japan, and the European Union all rose on the year, offset in part by year-on-year declines in exports to Australia and China. And unlike other countries, domestic demand in New Zealand is very solid as goods imports advanced 7.7 percent with solid increases for mechanical machinery and equipment. One country that has not only faired better than others on trade but has declared itself virus free, is lucky New Zealand. New Zealand's merchandise trade surplus widened from NZ$531 million in February to NZ$672 million in March. Growth in both exports and imports has improved as the country's trade flows have shifted from China and Australia to other markets, including the US and Japan. Exports of goods rose a year-on-year 3.8 percent in March, picking up from an increase of 3.4 percent in February. Food exports were particularly strong, boosted by a record harvest of kiwifruit and strong prices for meat and dairy products, partly offset by weaker demand for forestry products. Exports to the US, Japan, and the European Union all rose on the year, offset in part by year-on-year declines in exports to Australia and China. And unlike other countries, domestic demand in New Zealand is very solid as goods imports advanced 7.7 percent with solid increases for mechanical machinery and equipment.
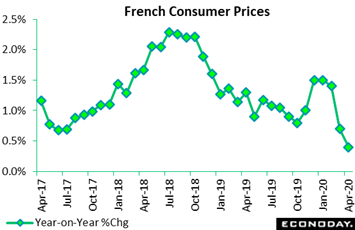 A less certain outcome of the virus on the global economy will be its impact on prices, more its magnitude that is uncertain than its direction. Prices for basics, including food, may very well rise though most, led by energy and discretionary goods, look to fall with oil of course already down substantially. Price data for April were released in Europe and here we look at France where headline CPI slid from an annual, and already very disinflationary, 0.6 percent, to just 0.4 percent and a 4-year low. Energy fell from minus 4.0 percent on the year to minus 8.5 percent partially offset by a 3.7 percent rise for food, up from March's 1.9 percent. And when talking about manufacturing and services, throw out the word disinflation: the word here is deflation, down at a 0.4 percent pace for the former and a rather sharp 1.1 percent for the latter. Due to virus effects, some points of sale were closed and many products were no longer available to purchase. As a result, the National Institute of Statistics and Economic Studies (INSEE) had to impute prices for more than 40 percent of France's CPI basket. A less certain outcome of the virus on the global economy will be its impact on prices, more its magnitude that is uncertain than its direction. Prices for basics, including food, may very well rise though most, led by energy and discretionary goods, look to fall with oil of course already down substantially. Price data for April were released in Europe and here we look at France where headline CPI slid from an annual, and already very disinflationary, 0.6 percent, to just 0.4 percent and a 4-year low. Energy fell from minus 4.0 percent on the year to minus 8.5 percent partially offset by a 3.7 percent rise for food, up from March's 1.9 percent. And when talking about manufacturing and services, throw out the word disinflation: the word here is deflation, down at a 0.4 percent pace for the former and a rather sharp 1.1 percent for the latter. Due to virus effects, some points of sale were closed and many products were no longer available to purchase. As a result, the National Institute of Statistics and Economic Studies (INSEE) had to impute prices for more than 40 percent of France's CPI basket.
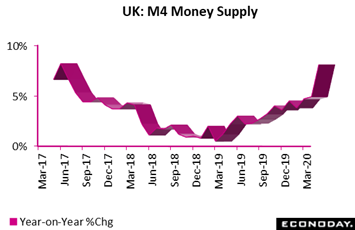 One area to watch during the upheaval is money supply. Boosted by corporate distress borrowing, broad money in the UK was very strong in March. M4 rose a monthly 2.8 percent in April for the 10th rise in a row and easily the largest of the streak. Annual growth as tracked in the graph jumped from 5.1 percent to 8.1 percent, a multi-year high. The key lending counterpart was almost as robust, advancing 2.7 percent versus February to stand 7.2 percent above its level a year ago. Excluding intermediate other financial corporations, M4 increased 2.5 percent on the month, raising its annual rate by nearly 3 percentage points to 7.4 percent. Similarly-adjusted lending followed suit, with a 2.6 percent monthly rate that put its yearly rate at 6.7 percent. One area to watch during the upheaval is money supply. Boosted by corporate distress borrowing, broad money in the UK was very strong in March. M4 rose a monthly 2.8 percent in April for the 10th rise in a row and easily the largest of the streak. Annual growth as tracked in the graph jumped from 5.1 percent to 8.1 percent, a multi-year high. The key lending counterpart was almost as robust, advancing 2.7 percent versus February to stand 7.2 percent above its level a year ago. Excluding intermediate other financial corporations, M4 increased 2.5 percent on the month, raising its annual rate by nearly 3 percentage points to 7.4 percent. Similarly-adjusted lending followed suit, with a 2.6 percent monthly rate that put its yearly rate at 6.7 percent.
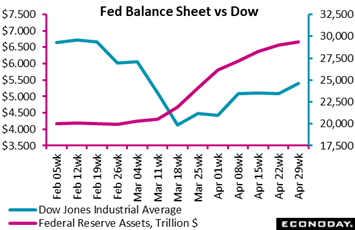 Stocks markets around the world have put in enormous recoveries over the last six weeks, in the wake of extreme stimulus moves by major central banks. Policy rates have moved to zero and quantitative easing is in full mode with the Federal Reserve announcing late last month that it would buy as many long-term government bonds as it sees fit. Let's look back to the pre-virus days in September when a lenders' strike made for a spike in US repo rates, which the Fed responded to by raising reserves by about $400 billion over a 4-month period. This move coincided with a sharp rise in the stock market. The Fed then described its actions as entirely technical in nature, realigning bank reserves with demand, unlike now when the move is aimed at preventing collapse and insolvency in the financial markets. The prior rise in the balance sheet has been quickly dwarfed by a $2.5 trillion increase over the past two months. It wouldn't press credulity to assume that a fair chunk of this increase, that is buying bonds and handing investors cash, is finding its way into the stock market. How high will the balance sheet go? No limits have yet been set which, for equities, may be a green light no matter how bad the economy gets. Stocks markets around the world have put in enormous recoveries over the last six weeks, in the wake of extreme stimulus moves by major central banks. Policy rates have moved to zero and quantitative easing is in full mode with the Federal Reserve announcing late last month that it would buy as many long-term government bonds as it sees fit. Let's look back to the pre-virus days in September when a lenders' strike made for a spike in US repo rates, which the Fed responded to by raising reserves by about $400 billion over a 4-month period. This move coincided with a sharp rise in the stock market. The Fed then described its actions as entirely technical in nature, realigning bank reserves with demand, unlike now when the move is aimed at preventing collapse and insolvency in the financial markets. The prior rise in the balance sheet has been quickly dwarfed by a $2.5 trillion increase over the past two months. It wouldn't press credulity to assume that a fair chunk of this increase, that is buying bonds and handing investors cash, is finding its way into the stock market. How high will the balance sheet go? No limits have yet been set which, for equities, may be a green light no matter how bad the economy gets.
Stock markets are doing well but are they really anticipating an economic recovery? Or is it just hot money? The timeline for recovery remains completely unclear. China may have stabilized the past couple of months but this was before the rest of the world went south. The only key is infection rates, whether they increase or hold steady as countries and states take tentative measures to reopen.
**Jeremy Hawkins, Brian Jackson and Mace News contributed to this article
Job status in North America will be the week's major news; both the US and Canada will be posting their April employment reports on Friday and staggering contraction is of course the expectation. Other April data will include Swiss unemployment, also posted Friday, and the construction PMI on Wednesday which will update shutdown effects in the UK. Also on Wednesday will be Chinese imports and exports, the latter updating virus effects on China's customers during April. March data of special interest will be manufacturers' orders on Wednesday and industrial production on Thursday, both from Germany, and Eurozone retail sales on Wednesday. Central banks are also on the week's slate: the Reserve Bank of Australia on Tuesday and the Bank of England on Thursday.
Reserve Bank of Australia Announcement (Tue 04:30 GMT; Tue 14:30 AEST; Tue 00:30 EDT)
Consensus Forecast, Change: 0 basis points
Consensus Forecast, Level: 0.25%
The Reserve Bank of Australia cut rates by 50 basis points in March, making two 25-basis-points cuts, one at a scheduled meeting and one at an emergency meeting that also produced QE and special banking facilities. At the last meeting in early April, the RBA made no moves with none expected for May's meeting. Later in the week on Friday, the RBA will be posting its quarterly statement on monetary policy which will provide updates on economic conditions and prospects, both of which of course have been upended by the virus.
Chinese Merchandise Trade Balance for April (Estimated for Wednesday, Release Time Not Set)
Consensus Forecast: No consensus
Chinese trade improved sharply in March, to year-on-year contraction of 6.6 percent versus 15.0 percent in the combined months of February and January, China's trade balance in March posted a surplus of US$19.9 billion. There is no consensus for April's results.
German Manufacturers' Orders for March (Wed 06:00 GMT; Wed 08:00 CEST; Wed 02:00 EDT)
Consensus Forecast, Month-to-Month: -8.7%
March orders at manufacturers are expected to fall 8.7 percent on the month. In February before the emergence of virus effects, German manufacturers' orders fell 1.4 percent on the month and were up 1.6 percent on the year.
UK: PMI Construction for April (Wed 08:30 GMT; Wed 09:30 BST; Wed 04:30 EDT)
Consensus Forecast: 20
PMI construction fell substantially in March, down more than 13 points to a recessionary 39.3. The April consensus is for further decline to 20.
Eurozone Retail Sales for March (Wed 09:00 GMT; Wed 11:00 CEST; Wed 05:00 EDT)
Consensus Forecast, Month-to-Month: -12.0%
Eurozone retail sales bounced back in February with a 0.9 percent gain, but expectations for March are another story. The consensus for the monthly reading is minus 12.0 percent.
German Industrial Production for March (Thu 06:00 GMT; Thu 08:00 CEST; Thu 02:00 EDT)
Consensus Forecast, Month-to-Month: -6.4%
A percent 6.4 percent decrease is expected for March industrial production, the first month of major virus effects that followed February's unexpected rise of 0.3 percent. Year-on-year, German industrial production was down 1.2 percent in February.
Bank of England Announcement (Thu 11:00 GMT, Thu 12:00 BST; Thu 07:00 EDT)
Consensus Forecast, Change: 0 basis points
Consensus Forecast, Level: 0.10%
Consensus Forecast: Asset Purchase Level: £645 billion
After a run of emergency moves in March, the Bank of England is expected to hold Bank Rate at a record low 0.10 percent and its asset purchase level at £645 billion.
US Initial Jobless Claims for May 7 Week (Thu 12:30 GMT; Thu 08:30 EDT)
Consensus Forecast: -3.0 million
Initial claims in the US have totaled more than 30 million over the past six weeks yet week-to-week readings, after peaking at just under 7 million in late March, have been coming down. Further slowing is the call for the May 2 week, with Econoday's consensus at 3.0 million versus 3.8 million in the April 25 week.
Swiss Unemployment Rate for April (Fri 05:45 GMT; Fri 07:45 CEST; Fri 01:45 EDT)
Consensus Forecast, Adjusted: 3.4%
Unemployment in Switzerland rose in both February and March with expectations for April, which like March was a month of lockdowns, calling for a 6 tenths rise in the adjusted rate to 3.4 percent.
Canadian Labour Force Survey for April (Fri 12:30 GMT; Fri 08:30 EDT)
Consensus Forecast: Employment Change: -1.8 million
Consensus Forecast: Unemployment Rate: 12.5%
Canadian employment is expected to collapse a further 1.8 million in April following March's giant contraction of 1.011 million. The unemployment rate is expected to come in at 12.5 percent versus March's 2.2 percentage point jump to 7.8 percent.
US Employment Report for April (Fri 12:30 GMT; Fri 08:30 EDT)
Consensus Forecast: Nonfarm Payrolls Change: -21.3 million
Consensus Forecast: Unemployment Rate: 16.3%
Profound payroll contraction is expected for April, at a consensus 21.3 million versus a 701,000 collapse in March that already was the deepest in 45 years. The US unemployment rate, after spiking 0.9 percentage points in March to 4.4 percent, is expected at 16.3 percent.
|

![[Apple App Store]](/images/AppleAppStore.png)
![[Econoday on Kindle]](/images/kindle.jpg)