|
It shouldn't be that big a surprise that the coronavirus, which has muddled all of our lives, should also be muddling economic data no less. What was looking like a drawn-out "u"-shaped trough for the global economy may now well be, based at least on US employment, a very quick "v"-shaped turnaround. "Unprecedented" is commonplace when it comes to describing the 2020 global economy, and that now includes the week's vast and truly unforgettable forecasting miss.
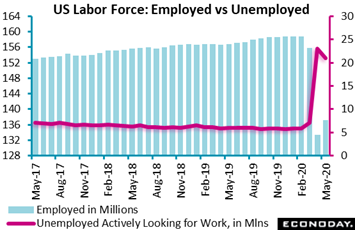 Shock after shock this year is now surpassed by the US employment report for May, where payrolls shot 2.509 million higher compared with Econoday's consensus for a loss of 7.725 million. That's a very sizable separation of 10 million plus?! Payrolls in May rose sharply in leisure and hospitality (1.239 million), construction (464,000), education and health services (424,000), as well as retail trade (367,800) and manufacturing (225,000). Turning to the headline from the report's household section which includes the self-employed who are not on payrolls, the unemployment rate, which was expected to approach 20 percent in May, fell 1.3 percentage points instead to 13.3 percent. This rate is the proportion between those employed (137.242 million in May as tracked by the blue columns in graph) and those actively looking for work (20.985 million as tracked by the red line). This would have been very good news, and may very well be good news, if it wasn't so completely unexpected. Shock after shock this year is now surpassed by the US employment report for May, where payrolls shot 2.509 million higher compared with Econoday's consensus for a loss of 7.725 million. That's a very sizable separation of 10 million plus?! Payrolls in May rose sharply in leisure and hospitality (1.239 million), construction (464,000), education and health services (424,000), as well as retail trade (367,800) and manufacturing (225,000). Turning to the headline from the report's household section which includes the self-employed who are not on payrolls, the unemployment rate, which was expected to approach 20 percent in May, fell 1.3 percentage points instead to 13.3 percent. This rate is the proportion between those employed (137.242 million in May as tracked by the blue columns in graph) and those actively looking for work (20.985 million as tracked by the red line). This would have been very good news, and may very well be good news, if it wasn't so completely unexpected.
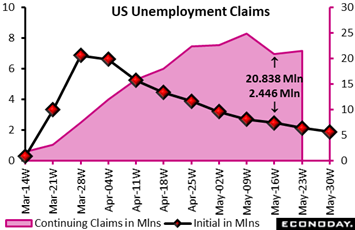 No forecaster on Econoday's panel was expecting an outright rise in May nonfarm payrolls, far from it with the least pessimistic forecast at a massive decline of 3.5 million. Two of the key tools that economists use to forecast monthly US employment data were not signaling strength at all, only weakness. Initial jobless claims extended their run of bloated readings, at 2.446 million in the May 16 week when the monthly employment report was sampled (black line with markers tracked on the left axis of the graph). And a second tool was no less downbeat: a call for a 2.760 million payroll decline from Automatic Data Processing which incorporates claims data to supplement indications from the sizable payroll base that it handles for clients. Yet there is one indication that does match up, and that's the number of continuing claims (red area measured on the right axis) which in the May 16 week came in at 20.838 million which compares closely with the 20.985 million actively looking for work in May's employment report. Yet even here, continuing claims were up nearly 3 million from the mid-month sample week for the April employment report (18.011 million in the April 18 week), a comparison that doesn't point to improvement. No forecaster on Econoday's panel was expecting an outright rise in May nonfarm payrolls, far from it with the least pessimistic forecast at a massive decline of 3.5 million. Two of the key tools that economists use to forecast monthly US employment data were not signaling strength at all, only weakness. Initial jobless claims extended their run of bloated readings, at 2.446 million in the May 16 week when the monthly employment report was sampled (black line with markers tracked on the left axis of the graph). And a second tool was no less downbeat: a call for a 2.760 million payroll decline from Automatic Data Processing which incorporates claims data to supplement indications from the sizable payroll base that it handles for clients. Yet there is one indication that does match up, and that's the number of continuing claims (red area measured on the right axis) which in the May 16 week came in at 20.838 million which compares closely with the 20.985 million actively looking for work in May's employment report. Yet even here, continuing claims were up nearly 3 million from the mid-month sample week for the April employment report (18.011 million in the April 18 week), a comparison that doesn't point to improvement.
There's certainly plenty of smoke and dust concealing what the actual status is of the labor market, underscored by discrepancies conceded by the Bureau of Labor Statistics (BLS) on how workers have been classified, whether employed but absent from work (where a large number were classified) or unemployed on temporary layoff. If these classifications were clarified, the bureau said the unemployment rate would have been about 3 percentage points higher in May (maybe 16 percent or more?). The BLS is looking into what the bureau itself describes as a "miscalculation" and what historians will generously call sloppy at best.
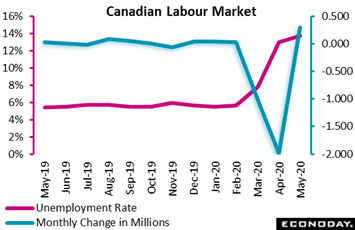 A confirmation, however, of employment improvement does come from Canada which, like the US, posted an unexpected rise. Employment in Canada rose 290,000 in May compared with expectations for a decline of 1.600 million and following 1.994 million contraction in April. The unemployment rate nevertheless rose 0.7 percentage points to 13.7 percent which, however, like employment, was far better than expectations which were calling for 16.2 percent. Strength was centered in the goods-producing sector which added 165,000 jobs though services also added 125,000. Total hours worked across all industries grew by 6.3 percent, led by construction (19.0 percent) with substantial recovery also seen in other services (13.2 percent), wholesale and retail trade (11.0 percent), manufacturing (10.9 percent), educational services (9.4 percent) and natural resources (9.2 percent). Also rising was the labour force participation rate which increased by 1.6 percentage points to 61.4 percent in May, though this is still well below February's pre-virus rate of 65.5 percent in a reminder that however much employment has bounced up, it still has a lot of climbing to do before it emerges from April's deep hole. A confirmation, however, of employment improvement does come from Canada which, like the US, posted an unexpected rise. Employment in Canada rose 290,000 in May compared with expectations for a decline of 1.600 million and following 1.994 million contraction in April. The unemployment rate nevertheless rose 0.7 percentage points to 13.7 percent which, however, like employment, was far better than expectations which were calling for 16.2 percent. Strength was centered in the goods-producing sector which added 165,000 jobs though services also added 125,000. Total hours worked across all industries grew by 6.3 percent, led by construction (19.0 percent) with substantial recovery also seen in other services (13.2 percent), wholesale and retail trade (11.0 percent), manufacturing (10.9 percent), educational services (9.4 percent) and natural resources (9.2 percent). Also rising was the labour force participation rate which increased by 1.6 percentage points to 61.4 percent in May, though this is still well below February's pre-virus rate of 65.5 percent in a reminder that however much employment has bounced up, it still has a lot of climbing to do before it emerges from April's deep hole.
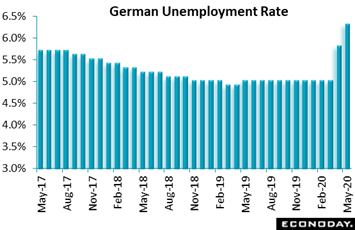 Unlike Canada and the US, labor markets in other developed economies have yet to show any vast destruction at all. In another employment report for May, Germany did report deterioration but not very much. The number of people out of work rose by 238,000 to 2.875 million following a 372,000 jump in April. The rise boosted the unemployment rate from 5.8 percent to 6.3 percent, a tick above expectations and the highest reading (not since the Great Depression or anything like that) but only since December 2015. Unemployment remains relatively low given the acute weakness of economic activity and reflects the huge and so far successful efforts being made by the German government to tackle the coronavirus. Unlike Canada and the US, labor markets in other developed economies have yet to show any vast destruction at all. In another employment report for May, Germany did report deterioration but not very much. The number of people out of work rose by 238,000 to 2.875 million following a 372,000 jump in April. The rise boosted the unemployment rate from 5.8 percent to 6.3 percent, a tick above expectations and the highest reading (not since the Great Depression or anything like that) but only since December 2015. Unemployment remains relatively low given the acute weakness of economic activity and reflects the huge and so far successful efforts being made by the German government to tackle the coronavirus.
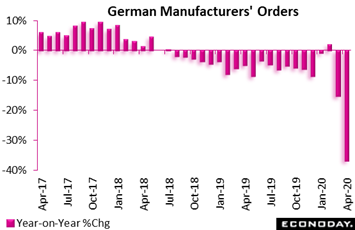 And acute weakness is no understatement for German activity, underscored by April manufacturers' orders which plummeted a record 25.8 percent compared to March to deepen annual contraction, as tracked in the graph, from 15.2 percent to 36.7 percent, also a new all-time low. The plunge reflected weakness in both domestic and overseas demand; the former shrinking 22.3 percent on the month and the latter a record 28.1 percent within which new orders from the rest of the Eurozone were down 30.6 percent. At a subsector level, the headline decline continued to be led by capital goods which dropped an unprecedented 30.6 percent on the month. Elsewhere, intermediates contracted 22.7 percent and consumer goods 11.4 percent. The ongoing collapse puts new orders 28.6 percent below their average level in the first quarter. This warns that, regardless of the ongoing easing in some lockdown restrictions, the near-term outlook for goods production is seriously bleak. And acute weakness is no understatement for German activity, underscored by April manufacturers' orders which plummeted a record 25.8 percent compared to March to deepen annual contraction, as tracked in the graph, from 15.2 percent to 36.7 percent, also a new all-time low. The plunge reflected weakness in both domestic and overseas demand; the former shrinking 22.3 percent on the month and the latter a record 28.1 percent within which new orders from the rest of the Eurozone were down 30.6 percent. At a subsector level, the headline decline continued to be led by capital goods which dropped an unprecedented 30.6 percent on the month. Elsewhere, intermediates contracted 22.7 percent and consumer goods 11.4 percent. The ongoing collapse puts new orders 28.6 percent below their average level in the first quarter. This warns that, regardless of the ongoing easing in some lockdown restrictions, the near-term outlook for goods production is seriously bleak.
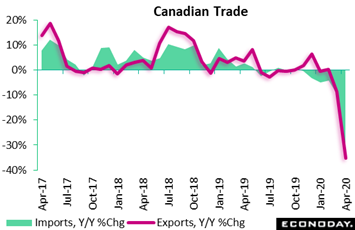 Weakness in goods production speaks to the severe contraction underway in cross-border trade. Canada's merchandise trade deficit widened in April to a larger than expected C$3.3 billion from C$1.5 billion in March. The widening reflected a larger drop in exports, at minus 35.2 percent on the year, that outpaced a similar drop in imports of minus 30.5 percent. Both declines are unparalleled and were caused by manufacturing shutdowns as well as falling energy prices, the closure of many retail stores, and weaker demand due to virus restrictions. Motor vehicles showed the largest declines ever observed, whether for exports or imports, the former hit by production shutdowns at all of Canada's auto plants. Among trading partners, the US was responsible for more than 90 percent of April's decrease in trading activity. The US also released its own trade report for April in the week, showing broadly comparable declines. Weakness in goods production speaks to the severe contraction underway in cross-border trade. Canada's merchandise trade deficit widened in April to a larger than expected C$3.3 billion from C$1.5 billion in March. The widening reflected a larger drop in exports, at minus 35.2 percent on the year, that outpaced a similar drop in imports of minus 30.5 percent. Both declines are unparalleled and were caused by manufacturing shutdowns as well as falling energy prices, the closure of many retail stores, and weaker demand due to virus restrictions. Motor vehicles showed the largest declines ever observed, whether for exports or imports, the former hit by production shutdowns at all of Canada's auto plants. Among trading partners, the US was responsible for more than 90 percent of April's decrease in trading activity. The US also released its own trade report for April in the week, showing broadly comparable declines.
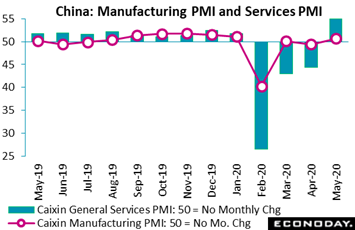 Not on the decline at all anymore is activity in China, at least based on May's purchasing managers indexes which are now over the breakeven 50 line. The Caixan manufacturing index (red line in graph) rose from 49.4 in April to 50.7 in May, indicating a small expansion in the sector. This was in line with another diffusion measure, CFLP's manufacturing index that came in at 50.6, with both surveys indicating that the manufacturing sector, as restrictions are being loosened, is continuing to recover from the virus impact at the start of the year. Caixan's index for the services sector rose sharply from 44.4 in April to 55.0 in May (blue columns) to indicate that activity in the sector expanded for the first time since January and at the fastest pace since 2010. Service sector respondents reported slowing contraction in employment as well as solid confidence in the business outlook. New orders were also strong despite another drop in export orders as the economic impact of the pandemic remained severe among China's major trading partners. Not on the decline at all anymore is activity in China, at least based on May's purchasing managers indexes which are now over the breakeven 50 line. The Caixan manufacturing index (red line in graph) rose from 49.4 in April to 50.7 in May, indicating a small expansion in the sector. This was in line with another diffusion measure, CFLP's manufacturing index that came in at 50.6, with both surveys indicating that the manufacturing sector, as restrictions are being loosened, is continuing to recover from the virus impact at the start of the year. Caixan's index for the services sector rose sharply from 44.4 in April to 55.0 in May (blue columns) to indicate that activity in the sector expanded for the first time since January and at the fastest pace since 2010. Service sector respondents reported slowing contraction in employment as well as solid confidence in the business outlook. New orders were also strong despite another drop in export orders as the economic impact of the pandemic remained severe among China's major trading partners.
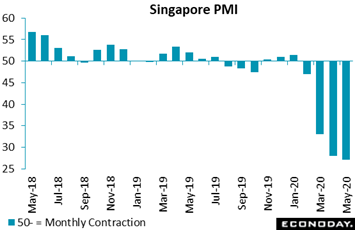 Covid-19, of course, first appeared in China where it hit the country's activity one step earlier than elsewhere. And other economies in Asia, in contrast to China, have yet to show much if any improvement including Singapore whose PMI fell further from 28.1 in April to an even more deeply contractionary 27.1 in May. Output, new orders, new export orders, and employment all remained very weak in May, with respondents' confidence about the year-ahead outlook deteriorating to a record low. Singapore's economy has continued to contract at an accelerating pace amid ongoing virus restrictions which, however, are scheduled to be eased beginning this month. Covid-19, of course, first appeared in China where it hit the country's activity one step earlier than elsewhere. And other economies in Asia, in contrast to China, have yet to show much if any improvement including Singapore whose PMI fell further from 28.1 in April to an even more deeply contractionary 27.1 in May. Output, new orders, new export orders, and employment all remained very weak in May, with respondents' confidence about the year-ahead outlook deteriorating to a record low. Singapore's economy has continued to contract at an accelerating pace amid ongoing virus restrictions which, however, are scheduled to be eased beginning this month.
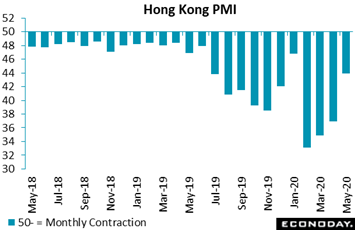 Infection rates in Hong Kong have been comparatively limited in what is the only plus for an economy that was previously pulled down by US-China trade disputes then civil unrest and is now being hit by China's security move which is raising questions over the city's future status as a global financial center. But for May, Hong Kong's PMI, though depressed at 43.9, still posted its best reading since January and the beginning of the covid crisis. Respondents reported smaller declines in output, new orders, new export orders, and employment in May, while the survey's measure of business confidence, though still weak, improved to a four-month high. Fiscal measures put in place by Hong Kong's government and an easing of restrictions in recent weeks have helped support activity. Infection rates in Hong Kong have been comparatively limited in what is the only plus for an economy that was previously pulled down by US-China trade disputes then civil unrest and is now being hit by China's security move which is raising questions over the city's future status as a global financial center. But for May, Hong Kong's PMI, though depressed at 43.9, still posted its best reading since January and the beginning of the covid crisis. Respondents reported smaller declines in output, new orders, new export orders, and employment in May, while the survey's measure of business confidence, though still weak, improved to a four-month high. Fiscal measures put in place by Hong Kong's government and an easing of restrictions in recent weeks have helped support activity.
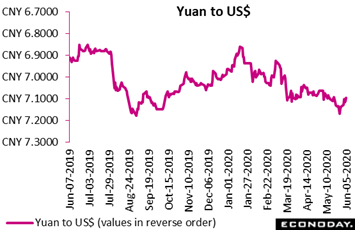 Considering the deep contraction underway in cross-border trade not to mention the risk of political fallout from coronavirus or the country's plans for Hong Kong, China may enjoy lessened demand for its low cost exports. Financial means could, however, provide an offset allowing the country to make its low priced exports even lower priced. China closely manages the yuan, the value of which often declines when the country faces controversy, declines that lower the cost of its goods to foreign buyers. This was clearly evident in August last year when trade tensions with the US were at their highest pitch, as it is clearly evident now. The graph tracks the value of the yuan against the US dollar in reverse order, that is as the number of yuan to the dollar goes up, the red line moves lower. It was only in the prior week that the yuan hit a low of CNY7.1693 on May 27, its lowest level since August 28 last year and two days before President Trump announced what amounted to a limited response to China's Hong Kong designs. The yuan has since risen roughly 1 percent over the last week to about CNY7.0900. China's other tool, less nimble but no less powerful, is of course its massive holdings of US Treasuries which have been coming down, by about $100 billion over the past couple of years to just under $1.1 trillion. Greater liquidation of Treasuries, if it should happen, would mark an acceleration in China's policy responses to outside pressure. Considering the deep contraction underway in cross-border trade not to mention the risk of political fallout from coronavirus or the country's plans for Hong Kong, China may enjoy lessened demand for its low cost exports. Financial means could, however, provide an offset allowing the country to make its low priced exports even lower priced. China closely manages the yuan, the value of which often declines when the country faces controversy, declines that lower the cost of its goods to foreign buyers. This was clearly evident in August last year when trade tensions with the US were at their highest pitch, as it is clearly evident now. The graph tracks the value of the yuan against the US dollar in reverse order, that is as the number of yuan to the dollar goes up, the red line moves lower. It was only in the prior week that the yuan hit a low of CNY7.1693 on May 27, its lowest level since August 28 last year and two days before President Trump announced what amounted to a limited response to China's Hong Kong designs. The yuan has since risen roughly 1 percent over the last week to about CNY7.0900. China's other tool, less nimble but no less powerful, is of course its massive holdings of US Treasuries which have been coming down, by about $100 billion over the past couple of years to just under $1.1 trillion. Greater liquidation of Treasuries, if it should happen, would mark an acceleration in China's policy responses to outside pressure.
Results aren't uniform but global economic contraction appears to have eased in May underscored dramatically by the surprise strength in the US and Canadian employment reports. But the jobs markets in both countries are still deeply underwater compared to the beginning of the year. Moreover, until initial claims in the US begin to come down significantly, there will be plenty of debate on how fast the labor market is healing and how successful monetary and fiscal actions are proving to be. With initial US claims rising a total of 12.2 million in the four weeks from the sampling of the April and May employment reports, something just isn't adding up.
**Jeremy Hawkins, Brian Jackson and Mace News contributed to this article
Key data will begin even before the working week starts as Chinese trade data for May are expected for Sunday, in a report that in April showed strength in exports but sharp weakness in imports. Industrial production in April will be the week's extended global theme beginning on Monday with Germany, from Italy on Thursday, and the UK and India on Friday. These reports, together with already released data from the US, China and Japan, will sketch out the actual depth of April's manufacturing hole. Virus unemployment has been vast in North America but has been limited in Europe with favorable results expected for Switzerland's unemployment rate on Tuesday. Forecasts for global second-quarter GDP (a quarter guaranteed to have its very own chapter in the history books) are beginning to take shape with the UK to contribute its April numbers on Friday. Inflation is still a wildcard in the virus economy, with actual data on the decline but expectations, at least for US consumers, rising sharply. Consumer prices will be posted in the US on Wednesday as will the CPI from China. And Wednesday will be an especially busy day for the US calendar, concluding in the afternoon with the Treasury's May budget statement (where a vast deficit should be no surprise) and the Federal Reserve's policy announcement (where little new is expected), both of which will be posted at 14:00 local time.
Chinese Merchandise Trade Balance for May (Estimated for Sunday, Release Time Not Set)
Consensus Forecast: US$44.5 billion
After April's surplus of $45.34 billion, a surplus of $44.5 billion is expected for May. Exports in April, up 3.5 percent year-on-year, were surprisingly solid in contrast to imports which contracted sharply, down 14.2 percent.
German Industrial Production for April (Mon 06:00 GMT; Mon 08:00 CEST; Mon 02:00 EDT)
Consensus Forecast, Month-to-Month: -16.2%
After plunging 9.2 percent in the first virus month of March, a 16.2 percent monthly drop is expected for the greater shutdown of April. Year-on-year, German industrial production in March was down 11.4 percent.
Swiss Unemployment Rate for May (Tue 05:45 GMT; Tue 07:45 CEST; Tue 01:45 EDT)
Consensus Forecast, Adjusted: 3.8%
Job destruction in Switzerland was limited in both March and April, when the unemployment rate for the latter rose only 4 tenths to 3.3 percent. For May, forecasters are looking for a 5 tenths increase to 3.8 percent.
Chinese CPI for May (Wed 01:30 GMT; Wed 09:30 CST; Tue 21:30 EDT)
Consensus Forecast, Year-over-Year: 2.7%
Consumer prices in China have remained strong but did slow sharply in April to a year-on-year rate of 3.3 percent. For May, a downdraft to 2.7 percent is the expectation.
US CPI for May (Wed 12:30 GMT; Wed 08:30 EDT)
Consensus Forecast, Month-to-Month Change: 0.0%
Consensus Forecast, Year-over-Year Change: 0.3%
US CPI Core, Less Food & Energy
Consensus Forecast, Month-to-Month Change: 0.0%
Consensus Forecast, Year-over-Year Change: 1.3%
After March's 0.4 percent decline, US headline prices declined another 0.8 percent in April with no change expected for May; core prices fell 0.2 percent and then 0.4 percent in April (the largest in 63 years of record) with no change here also May's consensus. Yearly rates were still above zero in April, at 1.4 percent for the core but only just barely overall at 0.3 percent. Here expectations are plus 1.3 percent for the core and plus 0.3 percent once again overall.
US Federal Reserve Policy Announcement (Wed 18:00 GMT; Wed 14:00 EDT)
Consensus Forecast, Change: 0 basis points
Consensus Forecast, Policy Range: 0.0% to 0.25%
With the bottom of the Federal Reserve's narrow target range already at zero, no change in the federal funds rate is expected. And having already completely opened the spigots on direct bond buying, the Fed's further options besides adding to loan schemes or tweaking banking regulations appear limited.
US Treasury Budget for May (Wed 18:00 GMT; Wed 14:00 EDT)
Consensus Forecast: No consensus
The Treasury's deficit in the single month of April totaled a staggering $737.9 billion, reflecting tax postponements and unemployment compensation. There is no consensus for May. The fiscal-year-to-date deficit in April was up 175 percent from the prior fiscal year.
Italian Industrial Production for April (Thu 08:00 GMT; Thu 10:00 CEST; Thu 04:00 EDT)
Consensus Forecast, Month-to-Month: -25.0%
After plunging 28.4 percent in the shutdown's initial effect during March, industrial production in Italy is expected to fall 25.0 percent in April. Annually, production was contracting at a 29.3 percent rate in March.
US Initial Jobless Claims for June 6 Week (Thu 12:30 GMT; Thu 08:30 EDT)
Consensus Forecast: 1.5 million
Levels of initial claims have remained staggering and have been barely slowing. Econoday's consensus for the June 6 week is for 1.5 million versus 1.877 million in the May 30 week.
UK GDP for April (Fri 06:00 GMT; Fri 07:00 BST; Fri 02:00 EDT)
Consensus Forecast, Month-to-Month: -15.1%
GDP fell 5.8 percent in the initial virus impact of March. Expectations for April GDP, during the first full month of lockdown, are at minus 15.1 percent.
UK Industrial Production for April (Fri 06:00 GMT; Fri 07:00 BST; Fri 02:00 EDT)
Consensus Forecast, Month-to-Month: -17.0%
After falling 4.2 percent on the month and 8.2 percent on the year in March, industrial production in the UK is seen at monthly contraction of 17.0 percent in April.
Indian Industrial Production for April (Fri 12:00 GMT; Fri 17:30 IST; Fri 08:00 EDT)
Consensus Forecast, Year-over-Year: -44.5%
How badly India's economy has suffered from virus restrictions will be evident in April's industrial production report. Year-on-year contraction came to 16.7 percent in the initial impact of March with enormous contraction of 44.5 percent expected for April.
|

![[Apple App Store]](/images/AppleAppStore.png)
![[Econoday on Kindle]](/images/kindle.jpg)